

If you’re taking a chemistry class or even a general science class, chances are pretty good that you have a copy of the Periodic Table of Elements. It might be hanging from a wall on a poster, or inside the back cover of your textbook. All the strange combination of letters, all the numbers – it can be very confusing. It’s almost information overload, right?
While all of the information is really useful, it can sometimes be hard to keep everything straight. Don’t worry! With this guide you’re reading, you don’t have to worry about the atomic weights. You don’t even have to pay attention to the numbers! All you have to do is locate an element on the Periodic Table, and the location alone is going to give you a lot of useful information. This is on purpose, by the way. When some of the pioneers of chemistry – Dimitri Mendeleev, Antoine Lavosier, and others – put together the puzzle pieces of the different elements, they intentionally arranged the elements table into its current form so that trends would start to pop out. Chemists could use these trends to make instant predictions about an element, without having to use any math at all. That’s what we’re going to be talking about today.
These trends are really easy to learn. We’re going to give you some basic “left to right” and “up to down” rules. Remember from your class that a horizontal line of elements going across the table is called a row, or a period. A vertical line of elements going up and down the table is called a column, or a group. You’re about to learn how to make four important predictions about atoms – atomic radius, ionisation energy, electron affinity, and electronegativity – just by judging how far “up or down” and “left to right” the element is in the Table. Sound like fun? Let’s get started!
Atomic Radius
You’ve probably learned from math class that a circle has a radius. If you draw a straight line through the centre of a circle, that’s called the diameter. If you half that distance, that’s the radius of the circle. We can imagine atoms as circles, and just like circles, atoms have radii. Because the outer edge of an atom (the border) is a little “fuzzy” – the electrons aren’t really pinned down, and sort of surround the nucleus in a cloud – we calculate atomic radius in a different way than a normal circle.
Imagine placing two atoms side by side next to each other. You can draw a horizontal line between the centre of the two atoms, like this:
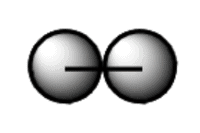
Half of the length of that line is the atomic radius. Atoms are very tiny. The atomic radius of iron metal is only 0.000000000126 meters! Knowing the size of an atom is important. When atoms combine to form molecules, and those molecules go on to do their jobs, we need to know if an atom is very big and bulky or if it’s small and doesn’t take up much room.
So, how does the Periodic Table give us a general trend for atomic radius? As you go from left to right across a period of elements (within the same row), you find the larger atoms on the left and the smaller atoms on the right. This means that atomic size slowly decreases as you go from left to right. Why is this? Remember that as you go to the right across a row, you’re adding protons to the nucleus. These additional protons add more positive charge to the nucleus, which means that the nucleus has a stronger “pull”, or attraction, on the negatively charged electrons (opposites attract). The overall effect is to pull the outer shell of electrons closer towards the centre of the atom. This shrinks the size of the atom.
So that’s going from left to right. What about from up and down?
As you go down a group (a column) in the Periodic Table, the atomic radius starts to increase. This is because we’re adding more layers of electrons, smothering the positive protons at the centre. The outermost electrons (known as the valence electrons) start to get further away from the nucleus. The positively charged protons at the nucleus have a harder time attracting these distant electrons, and so the outermost electrons have more freedom to move around. This expands the atomic radius.
So, in summary: the atomic radius decreases as you go from left to right and increases as you go from up to down. Let’s try a test, to see if this trend works. Find chromium, Cr, on the Table (it’s #24). Compare it to copper, Cu, which is #29; it’s to the right of chromium. If our left-to-right trend is correct, atomic size should decrease as we go towards the right side of the Table. The atomic radius value for chromium is 200 picometers. The atomic radius value for copper is 128 picometers. Just like we predicted, the atomic radius went down as we went from left to right! See how easy that was?
Let’s try the other trend, going from up to down. Find lithium, Li, on the Table (it’s #3). Compare it to cesium, Cs, which is #55, and below lithium. If our up-down trend is correct, cesium should have a larger atomic radius than lithium. The atomic radius value for lithium is 152 picometers. The atomic radius value for cesium is 300 picometers – almost double the size of lithium.
Just by glancing at the table, and knowing some easy trends, you can now compare any two atoms on the Periodic Table and take a really good guess at which one of them has the largest atomic radius. That’s a wonderful skill. What other trends exist? Let’s take a look at something called Ionisation Energy.
Ionisation energy trends
First, let’s define what we’re talking about. An atom usually starts out with no positive or negative charge. It’s neutral, with just as many negative electrons as positive protons. If we remove an electron from an atom, that atom will have a positive charge because now it has more protons than electrons. We call these charged atoms “ions”. Trying to turn a neutral atom into an ion by removing an electron requires a certain amount of energy. This value is called the Ionisation energy.
Not all elements behave the same when something tries to take one of its electrons. Some elements are fairly happy to give up an electron, while other elements will put up a fight because they want to hold onto all of their electrons. This means that each element on the Periodic Table is going to have a different value for its Ionisation energy.
If an atom has a low Ionisation energy, it means that atom is pretty happy and willing to give up one of its electrons and become a positive ion. It doesn’t take much convincing – much energy – to remove an electron from these types of atoms. On the other hand, atoms which really want to hold onto their electrons are going to require a lot of convincing for them to lose an electron. Atoms like this have a high Ionisation energy.
So, what’s the trend? The elements which are towards the right-hand side of the Periodic Table usually have a higher Ionisation energy than elements which are on the left-hand side of the Periodic Table. This is due in part to the “octet” rule, which you’ve probably learned about its class. It’s a general rule-of-thumb which says that atoms are at their most stable when they have a total of eight electrons in their outer shell. Take sodium, for as an example. Sodium (“Na”, on the Periodic Table), is on the far left of the chart. Neutral sodium has 11 electrons, with 1 electron in its outer shell. If it could just lose this one electron, it would have eight electrons in its new “outer shell” (the layer beneath the electron which got taken).
Atoms love to have eight electrons in their outer shell (the “octet rule”). Because giving up this one electron would let sodium become much more stable, it doesn’t take much energy to convince sodium to give up this lone electron. As a result, we say that sodium has a low Ionisation energy.
Now, consider an example from the far right of the Periodic Table, such as chlorine. Chlorine has seven electrons in its outer shell. If it could just gain one more electron, it would have eight electrons (a full octet) and would be very stable. So, the chlorine atom is doing everything it can to gain an electron. Trying to go in the opposite direction – taking away one of the electrons chlorine already has – just makes the atom’s problems worse. As a result, it’s going to take a lot of energy to make this happen. We say that chlorine has a high Ionisation energy.
That’s the “left to right” Periodic Table trend for Ionisation energy. Elements which are on the left side of the Periodic Table all want to give up electrons, so they have low Ionisation energies. Elements which are on the right side of the Periodic Table all want to gain electrons; they certainly don’t want to give up any electrons they already have! Therefore, elements towards the right of the Periodic Table have a high Ionisation energy.
That’s going from left to right. What about up and down the Table? As you start to go down from the top of the Periodic Table, the positively-charged protons at the nucleus become smothered by layer after layer of electrons. This lowers the “opposites attract” effect between the protons and the electron on the outer shell of the atom. As a result, Ionisation energy usually goes down as you move down a group (column) on the table.
So, the overall trend: Ionisation energy increases as you go from left to right and decreases as you go from up to down! Let’s test this with actual values for Ionisation energy. We mentioned above that sodium should have a low Ionisation energy, because it’s on the left-hand side of the Table – it wants to give up an electron. Sodium has an Ionisation energy of 496 kilojoules per mole. We mentioned above that chloride should have a high Ionisation energy, because it’s on the right-hand side of the Table – it really doesn’t want to give up its electrons. Chlorine has an Ionisation energy of 1251 kilojoules per mole. Our trend is correct!
What about some actual values going from up to down? Find carbon on the Periodic Table (it’s #6). Carbon has an Ionisation energy of 1086 kilojoules per mole. Now, find lead (Pb) on the Periodic Table (it’s below carbon, #82). Lead has an Ionisation energy of 715 kilojoules per mole. So, our trend that Ionisation energies tend to decrease as you go from the top of the Table to the bottom holds true.
If you can remember this basic guideline, you can glance at the Periodic Table and predict how easy it’ll be to remove an electron from an atom. Isn’t that neat?
Let’s take a look at another Periodic Table trend. Simple guidelines are great tools for chemists!
Electron affinity trends
Electron affinity is the opposite concept to Ionisation energy. With Ionisation energy, we were predicting how easy it would be to take away an atom’s electron. With electron affinity, we’re going to predict how easy it would be to give an atom another electron.
So, how can we look at the Periodic Table and get a general idea of electron affinity – what’s the trend?
As you go from up to down in a column (group), the electron affinity decreases. This is explained by the change in atomic radius. As the distance between the positively-charged nucleus and the negatively-charged electron gets larger, the “opposites attract” effect decreases. This causes the electron affinity to decrease. As you go from left to right across a row, the atomic radius decreases (see above explanation). So, any extra electrons you add are going to be closer to the positively-charged nucleus. So, the electron affinity increases as you go from left to right across a row (a period).
Let’s test this out with some actual data. Find lithium, Li, on the Table (it’s #3). Compare it to cesium, Cs, which is #55, and below lithium. If our up-down trend is correct, cesium should have a lower electron affinity than lithium. The actual electron affinity value for lithium is 60 kilojoules per mole. The actual electron affinity value for cesium is 46 kilojoules per mole. So, the up-down trend works.
What about left-right? Compare sodium (#11) to chlorine (#17). If our left-right trend is correct, chlorine should have a lower electron affinity than sodium. The actual electron affinity value for sodium is 53 kilojoules per mole. The actual electron affinity value for chlorine is -349 kilojoules per mole. The left-right trend also works!
It may seem strange to you that both taking away an electron from an atom (Ionisation energy) and giving an electron to an atom (electron affinity) have similar trends. It’s because the first (Ionisation energy) is driven by the atoms desire to have a filled outer valence shell of electrons (the “octet rule”). The second (electron affinity) is driven by atomic radius. Either way, you have another powerful trend to use for making predictions from the Periodic Table!
Let’s talk about our final property, and we’ve saved the best for last: Electronegativity.
Electronegativity trends
Electronegativity is a measure of an atom’s “greediness” for electrons. In a covalent bond between two atoms, each atom shares an electron with the other atom to form the bond. However, it’s not always an equal sharing. Some atoms are more electronegative, meaning they try to pull some of the supposedly “shared” electron density back to their side. This tug of war results in not an equal sharing, but an unequal sharing of the two electrons in the bond between atoms.
There’s no standard, experimental method for measuring electronegativity. However, a famous chemist named Linus Pauling developed what’s now called the Pauling Scale. You should have access to this in your textbook, or you can find it on the Internet. He assigned every element on the Periodic Table an electronegativity value, ranging from 0 to 4. Higher values meant that the atom was more electronegative, and therefore more “greedy” for electrons.
What are the trends that we can use to predict electronegativity? As you go from left to right across a row (a period), the electronegativity increases. This goes back to the “octet” rule. Elements towards the left tend to have a valence shell that is less than half full, and so they try to give away their electrons to gain a filled outer shell of eight electrons. This means they have a low electronegative. Elements towards the right tend to have a valence shell that is more than half full, so it makes sense for them to try to pull in extra electrons to fill in the gaps. That will give them a filled outer shell, making them very stable according to the octet rule.
As you go from top to bottom down a column (a group), electronegativity decreases. This is because the atomic radius is increasing as you go down, and the positive proton core is smothered by layers of electrons. As a result, it becomes less of a pressing issue to have a filled outer valence shell of electrons, as the attraction to the positively-charged core is diminished by the increased distance.
So, our trend is that electronegativity increases as you go from left to right and decreases as you go from up to down. Let’s look up the values for some examples from the Pauling scale. Again, this table is probably in your textbook, but if not, you can find it on the Internet. Compare Francium (#87), which is at the lower left of the table, with Fluorine (#9), which is at the upper right of the table. Francium has a Pauling electronegativity value of 0.7, while fluorine has a Pauling electronegativity value of 3.98. These two elements are the two extremes of electronegativity. Francium is the least electronegative element, and fluorine is the highest. So, our trend is correct!
Why is this important? When you’re trying to determine how a molecule is going to react, you have to keep track of the electrons. Knowing which atoms are “greedy for electrons” (have a high electronegativity value) helps you to make predictions. For example, Teflon is a plastic made with a lot of fluorine atoms. Chemical reactions take place through electrons, but because fluorine is so “greedy for electrons” (has such a high electronegativity), it doesn’t want to give up any of its electrons so that they can take part in a chemical reaction. That’s why Teflon is so unreactive towards many chemicals. The fluorines are holding tight to the electrons, and don’t want to let them go; this means that no chemical reactions can take place.
So, there you have it! Four simple sets of basic “left-right” and “up-down” rules, requiring zero math, allow you to just glance at the Periodic Table and make all types of predictions about how an atom can behave. Studying chemistry can sometimes feel overwhelming. Remembering the basic trends in this article will help simplify things for you tremendously and make learning chemistry less stressful and more relaxed.
Have fun!


